

Tutorial 3: Rich Outputs
MyST supports a full range of scientific publishing features natively.
Figures with captions
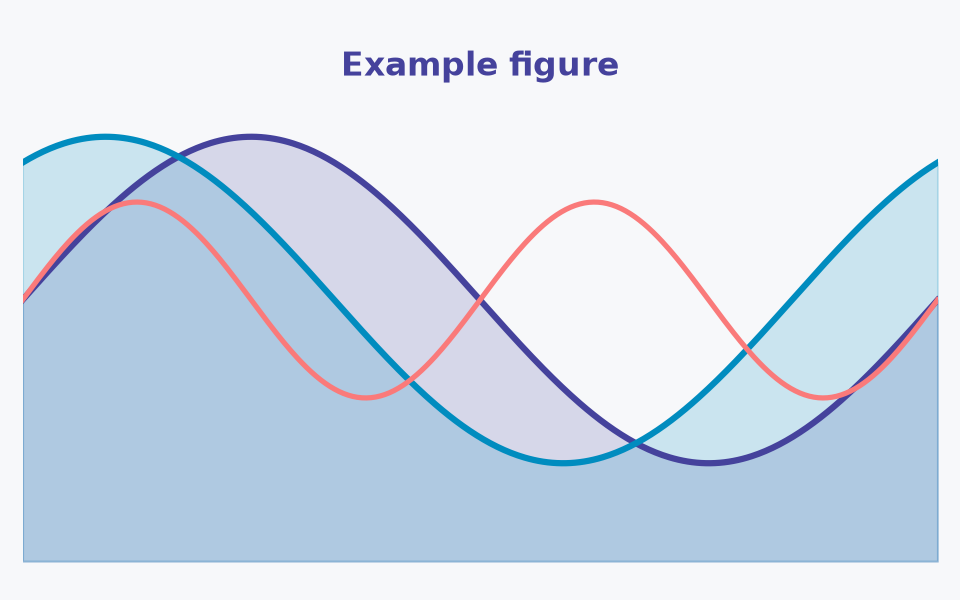
Figure 1:A figure with a caption and a label. Reference it elsewhere with Figure 1.
The image lives in images/ next to this page. Paths are relative to the page,
which is also the working directory when the page’s code runs.
Where images and data files go
Keep a day’s files in that day’s folder, next to the pages that use them:
tutorials/W1D1_GettingStarted/
  W1D1_Tutorial3.md
  images/example_figure.png     # figures
  data/                         # small data files (create it when you need it)
Beside the page. With only one or two files, put them directly next to the page. Add
images/anddata/once a day has more.Site-wide files (a custom logo,
extra.css) go in a root_static/folder, which you create when needed (see W1D3 Tutorial 3).On the site, relative image paths just work.
In the generated notebooks (Colab/Kaggle), the kit does not copy a day’s images or data files into
notebooks-branch, and{figure}directives are not rendered there. For an image or data file a notebook needs, use an absolute URL:https://raw.githubusercontent.com/<org>/<repo>/main/tutorials/<Day>/images/<file>. In the browser, fetch data files withpyodide.http.open_url(see W1D2 Bonus), since Pyodide has no sockets.
Math
Inline math:
Display math with a label:
Reference equations: see (1).
Cross-references
Label any heading with (label)= and reference it with the ref role.
This section has a label
Refer back to it anywhere in the book using: ref to sec-crossref-demo.
Matplotlib figures from code
Tables
| Column A | Column B | Column C |
|---|---|---|
| Value 1 | Value 2 | Value 3 |
| Value 4 | Value 5 | Value 6 |
Summary
Use the figure directive for captioned images with labels
Use double-dollar signs for display math with optional equation labels
Use (label)= syntax to label headings and cross-reference them
Code cells produce embedded figures automatically